Interpretation
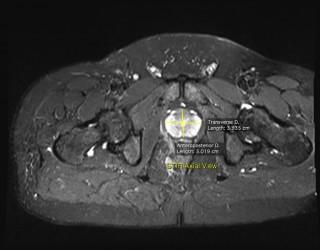
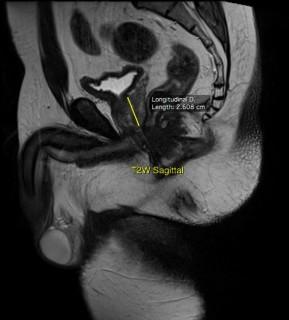
1. Calculate Prostate gland volume: It is measured using the formula - maximum anterior posterior diameter x maximum transverse diameter × maximum longitudinal diameter x 0.52. We personally prefer T2W and T2 Fat suppressed images for the measurements.
2. Peripheral Zone : Scan peripheral zone of Prostate for any focus of restricted diffusion on DWI & ADC Map images.
| DWI / ADC Sequence | | | PI - RADS Category |
| No signal abnormality in DWI / ADC | | | 1 |
| Indistinct hypointensity on ADC | | 2 | |
| Mild to moderate hypointensity on ADC and isointense to mildly hyperintensity on DWI | Dynamic Contrast | Negative (No focal early contrast enhancement) ------------------------- Positive (Focal early contrast enhancement) | 3 -- 4 |
| Focal markedly hypointensity on ADC and markedly hyperintensity on DWI BUT size less than 1.5cm. | | 4 | |
| Focal markedly hypointensity on ADC and markedly hyperintensity on DWI of size > 1.5cm or signs of capsular invasion / periprostatic spread | | | 5 |
| | | | |
3. Transition Zone : Scan transition zone of Prostate on T2W images.
| T2W Sequence | | | PI - RADS Category |
| Homogeneous intermediate signal intensity (normal) | | | 1 |
| Well-defined hypointense or heterogeneous encapsulated nodules (BPH) | | | 2 |
| Poorly-defined heterogeneous with indistinct margins | DWI Score | Less or equal to 4 ------------------- 5 | 3 -------- 4 |
| Poorly-defined moderately hypointense But less than 1.5cm size | | | 4 |
| Poorly-defined hypointense lesion of size more than 1.5cm or signs of extraprostatic invasion | | | 5 |
| | | | |
Formulate Report
After interpreting images, it is time to formulate the report. The report should include
- Technical details : About the MRI Scanner and sequences used. The mentioning of sequences is important for follow up of case.
- Brief clinical details : Presenting complaints, DRE examination findings*, PSA values*, Biopsy details* & any previous MRI study, if available.
- Findings : The size of the Prostate. The details about lesions (size, location, signal intensity, restricted diffusion, contrast enhancement locoregional spread/infiltration). Presence or absence of possible lymph nodal and bone metastases. Additional / incidental finding if any.
- Impression : The brief conclusion of findings with PI-RADS V2 Score.
- Key images : The size of Prostate measured on T2W Axial and T2W Sagittal; The delineation of lesion(s) on T2W, DWI, ADC & Contrast Axial images.
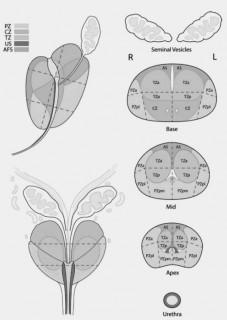
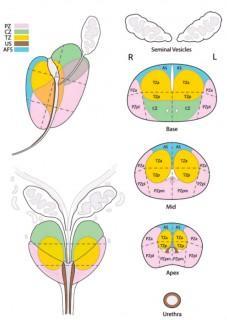
- Prostate Sector Map :
Reporting Template : Normal
MR IMAGING OF PELVIS: PLAIN & CONTRAST
| Sequences | Planes | Sequences | Planes |
| TSE T1WI | Coronal, Sagittal | TSE T2WI | Axial, Coronal & Sagittal |
| FS TIRM T2WI | Axial, Coronal & Sagittal | DWI & ADC | Axial |
| Contrast FS Dixon T1 | Axial & Sagittal | Dynamic Contrast FS VIBE T1 | Axial |
Multiplanar multiecho MRI study has been performed on 1.5 Tesla MRI using above sequences. In addition, dynamic post contrast images are obtained.
Clinical Details :
FINDINGS :
Prostate & seminal vesicles:
The prostate is normal in size, shape and signal pattern. No obvious discrete mass lesion or abnormal enhancing focus within. No significant median lobe projection over bladder base. The prostatic capsule appears intact. Periprostatic fat planes are normal.
Both seminal vesicles appear normal in size and MR morphology for present age. No significant pelvic lymphadenopathy.
Urinary bladder:
Urinary Bladder is partially distended. The urine is homogenous in signal. No obvious mass lesion.
Pelvic cavity:
The visualized bowel loops appear normal in morphology. No free fluid in peritoneal cavity.
Musculoskeletal:
The hip and sacro-iliac joints joint appears normal. The visualized bones appear normal with normal marrow signal. The visualized pelvic musculature and extrapelvic soft tissues are within normal limits.
IMPRESSION :
- MR Imaging of Pelvis is within normal limits.
Reporting Template : Abnormal
MR IMAGING OF PELVIS: PLAIN & CONTRAST
| Sequences | Planes | Sequences | Planes |
| TSE T1WI | Coronal, Sagittal | TSE T2WI | Axial, Coronal & Sagittal |
| FS TIRM T2WI | Axial, Coronal & Sagittal | DWI & ADC | Axial |
| Contrast FS Dixon T1 | Axial & Sagittal | Dynamic Contrast FS VIBE T1 | Axial |
Multiplanar multiecho MRI study has been performed on 1.5 Tesla MRI using above sequences. In addition, dynamic post contrast images are obtained.
Clinical Details : C/o Mild prostatic symptoms. Raised PSA 6.0. Firm consistency of right lobe of Prostate on DRE.
FINDINGS :
Prostate & seminal vesicles:
Prostate is mildly enlarged (measures 4.5 x 4.1 x 3.5 cm; Vol: 33.6) with diffuse expansion and marked heterogeneity of the transition zone, mild thinning of the peripheral zone and heterogeneous parenchymal enhancement, suggestive of prostatic hyperplasia. There is focal T2W hypointense signal intensity lesion in right peripheral zone of mid prostate extending down to the apex level, measures upto 9mm. It shows low signal intensity on corresponding ADC map. There is early and higher enhancement of the lesion relative to the normal parenchyma after administration of contrast. Thickening and irregularity of adjoining prostatic capsule is present. In addition, few similar nodular and ill-defined areas are seen in transition zone of mid prostate on both sides, largest measures upto 7mm. Rest of the prostatic capsule appears intact.
Both seminal vesicles are visualized separately; appear normal in size and MR morphology for present age.
No significant pelvic lymphadenopathy.
Urinary bladder:
Urinary Bladder is well distended. The urine is homogenous in signal. Mild diffuse wall thickening and mucosal irregularity of bladder noted, consistent with chronic cystitis. No obvious bladder mass lesion.
Pelvic cavity:
The visualized bowel loops appear normal in morphology. No free fluid in peritoneal cavity.
Musculoskeletal:
The visualized pelvic musculature and extrapelvic soft tissues are within normal limits.
IMPRESSION : MRI Pelvis study reveals –
• Mildly enlarged prostate showing diffuse expansion of the transition zone, mild thinning of the peripheral zone and heterogeneous enhancement - suggestive of Prostatic hyperplasia.
• Focal T2W hypointense signal intensity lesion in right peripheral zone of mid prostate extending down to the apex level, measures upto 9mm. It shows low signal intensity on corresponding ADC map. There is early and higher enhancement of the lesion relative to the normal parenchyma after administration of contrast. Thickening and irregularity of adjoining prostatic capsule is present. In addition, few similar nodular and ill-defined areas are seen in transition zone of mid prostate on both sides, largest measures upto 7mm. These findings are suspicious for multi-focal Prostatic Malignancy (T3a Disease / PI-RADS 4).
• No suspicious locoregional / pelvic lymph nodes or bone lesions in imaged regions.
Suggested : Histopathological correlation (Multiquadrant Biopsy).Tip to insert Sector Map in Word Template:
1. Download Black / White or Color Sector Map Picture on your computer by using right click of Mouse and Save as option.
2. Insert Picture in your report and take a printout. Highlight the areas of signal abnormality by Pen.
PI-RADS™ v2 assessment categories
| PI-RADS 1 | Very low (clinically significant cancer is highly unlikely to be present) |
| PI-RADS 2 | Low (clinically significant cancer is unlikely to be present) |
| PI-RADS 3 | Intermediate (the presence of clinically significant cancer is equivocal) |
| PI-RADS 4 | High (clinically significant cancer is likely to be present) |
| PI-RADS 5 | Very high (clinically significant cancer is highly likely to be present) |